Vernier Graphical Analysis®

Collect, share, and analyze sensor data with our free software for Chrome™, Windows®, macOS™, iOS, and Android™.


$0.00
Data Collection
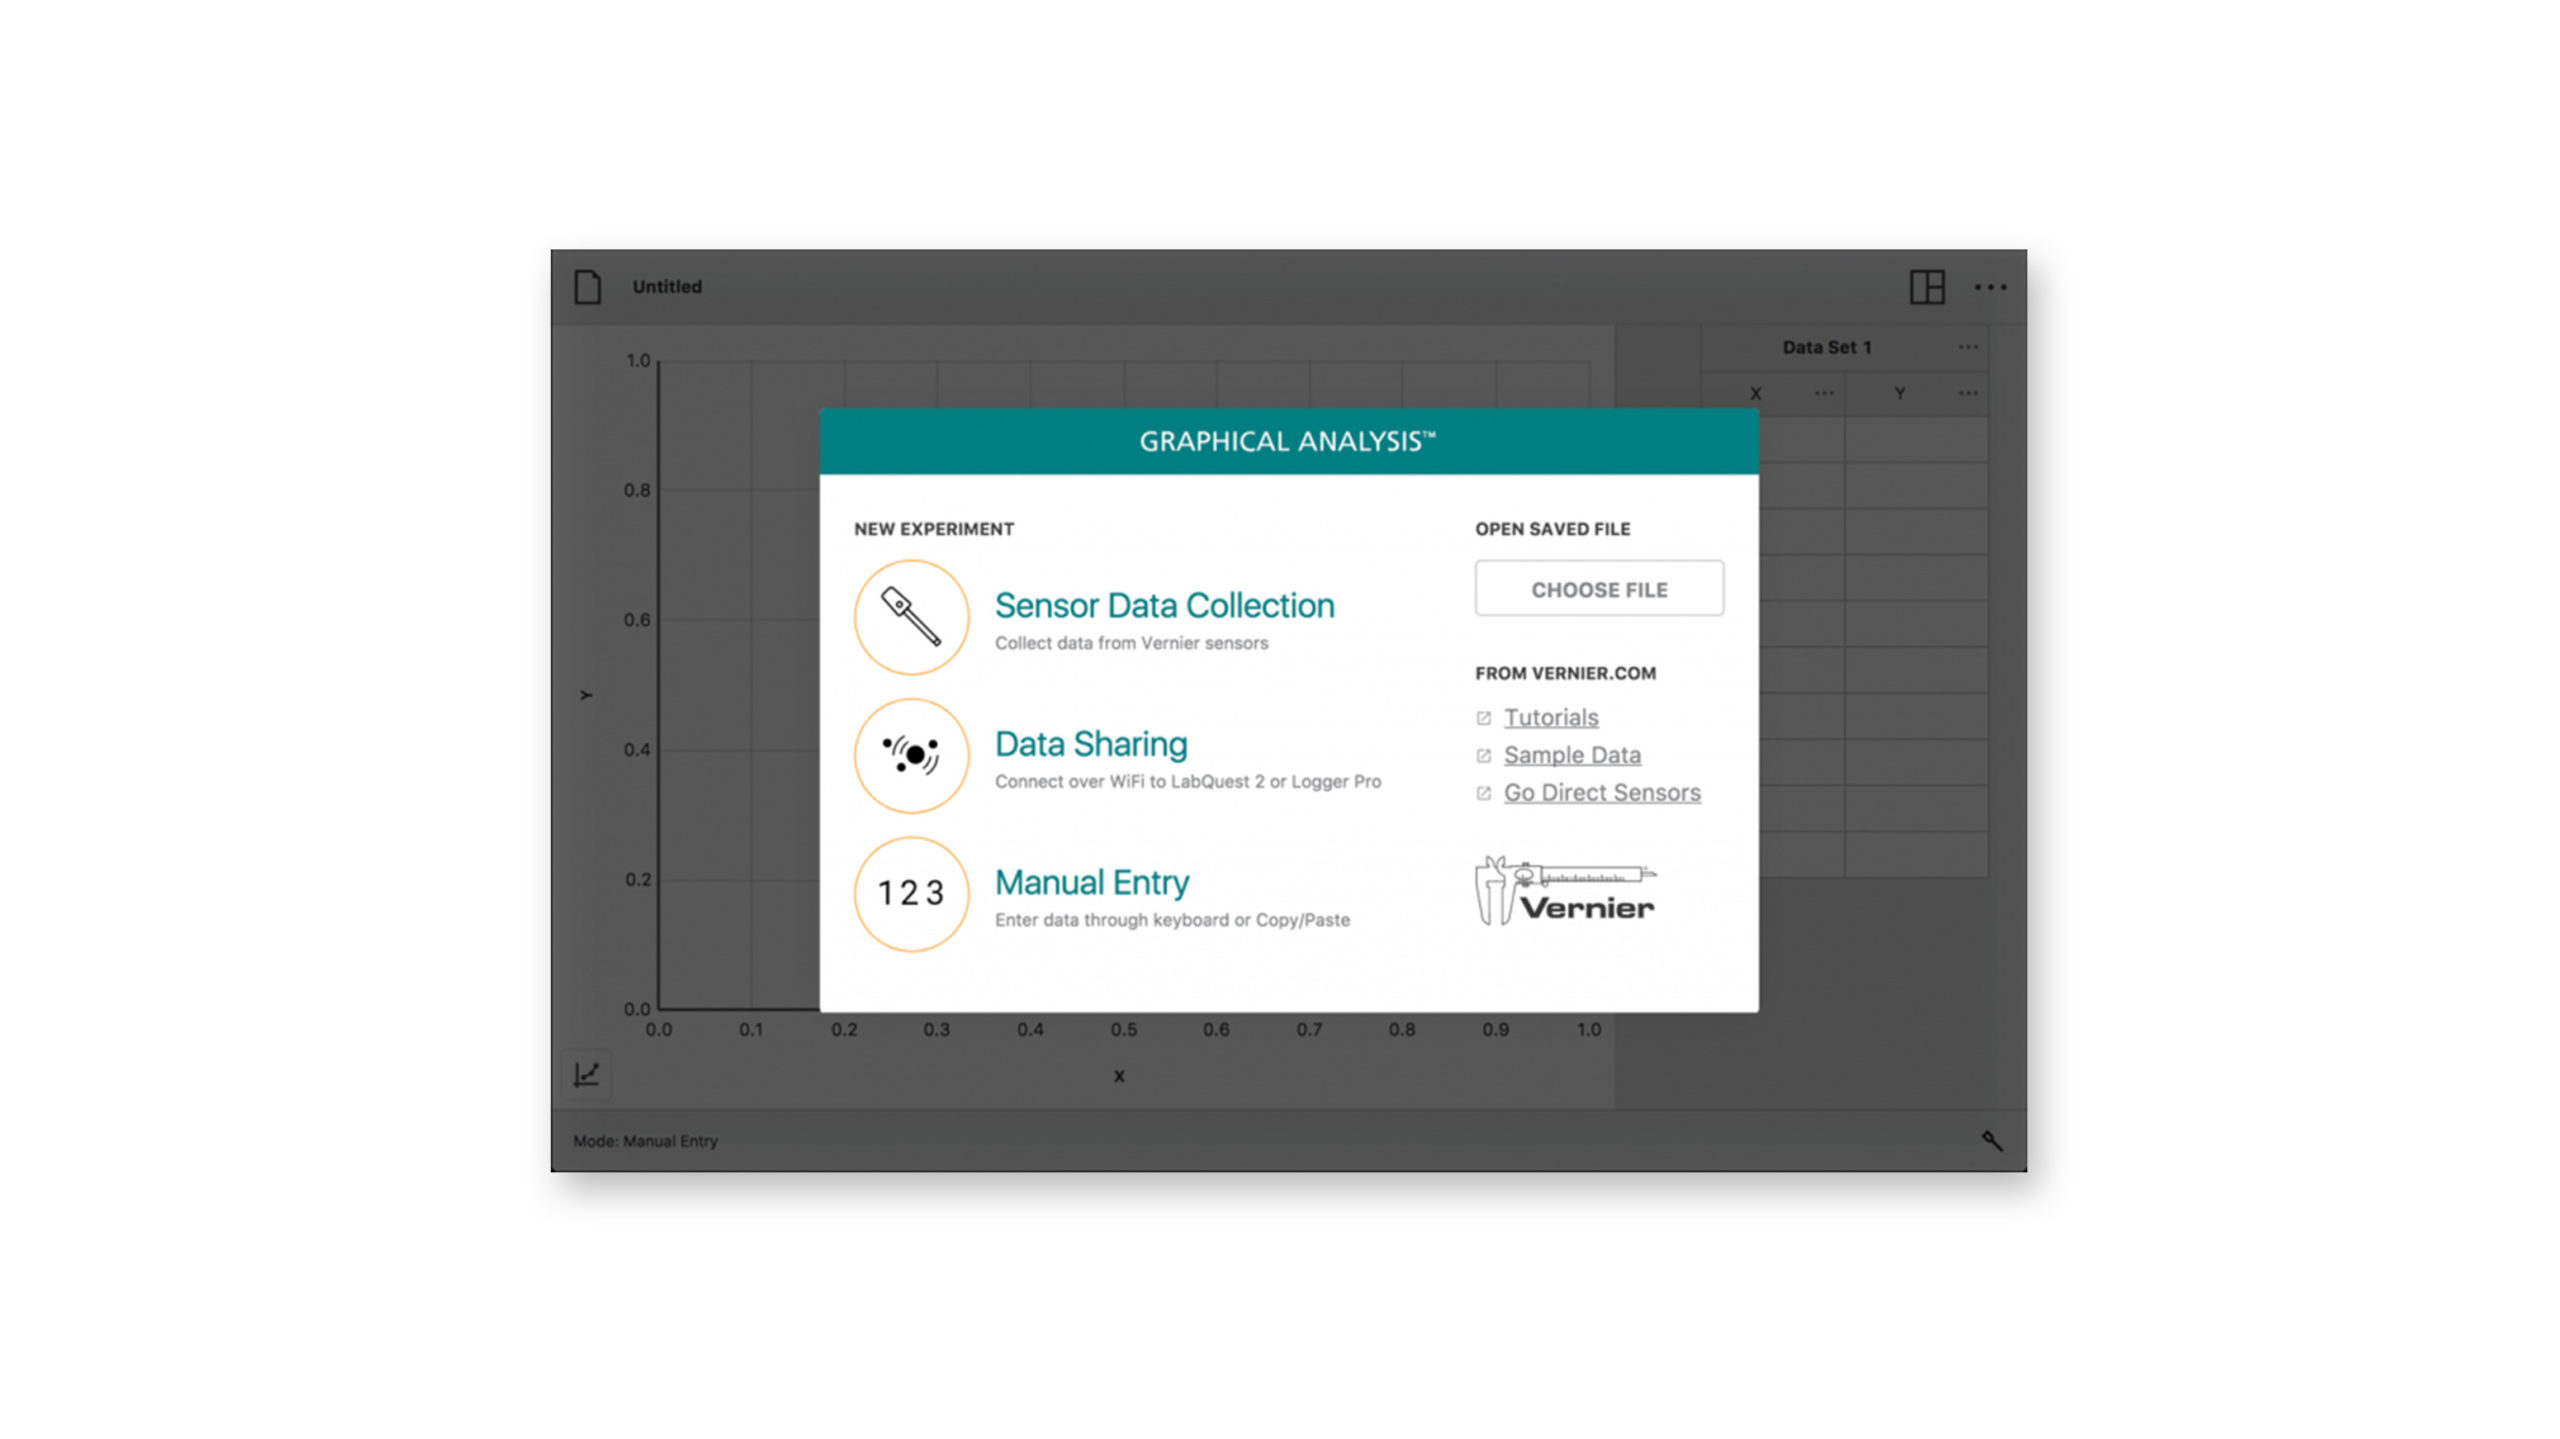
- Collect data from multiple sensors simultaneously, either with a multiple-channel interface such as LabQuest Stream or by using multiple Go Direct sensors. Use Data Sharing to retrieve data from just about every Vernier sensor.
- Select time-based or event-based data collection, including events with entry.
- Adjust data-collection rate and duration as needed.
- Trigger time-based data collection on sensor values.
- Calibrate sensors, although most of the time this is not needed.
- Enter data manually or using the clipboard.
- Change display units on many sensors.
Data Analysis
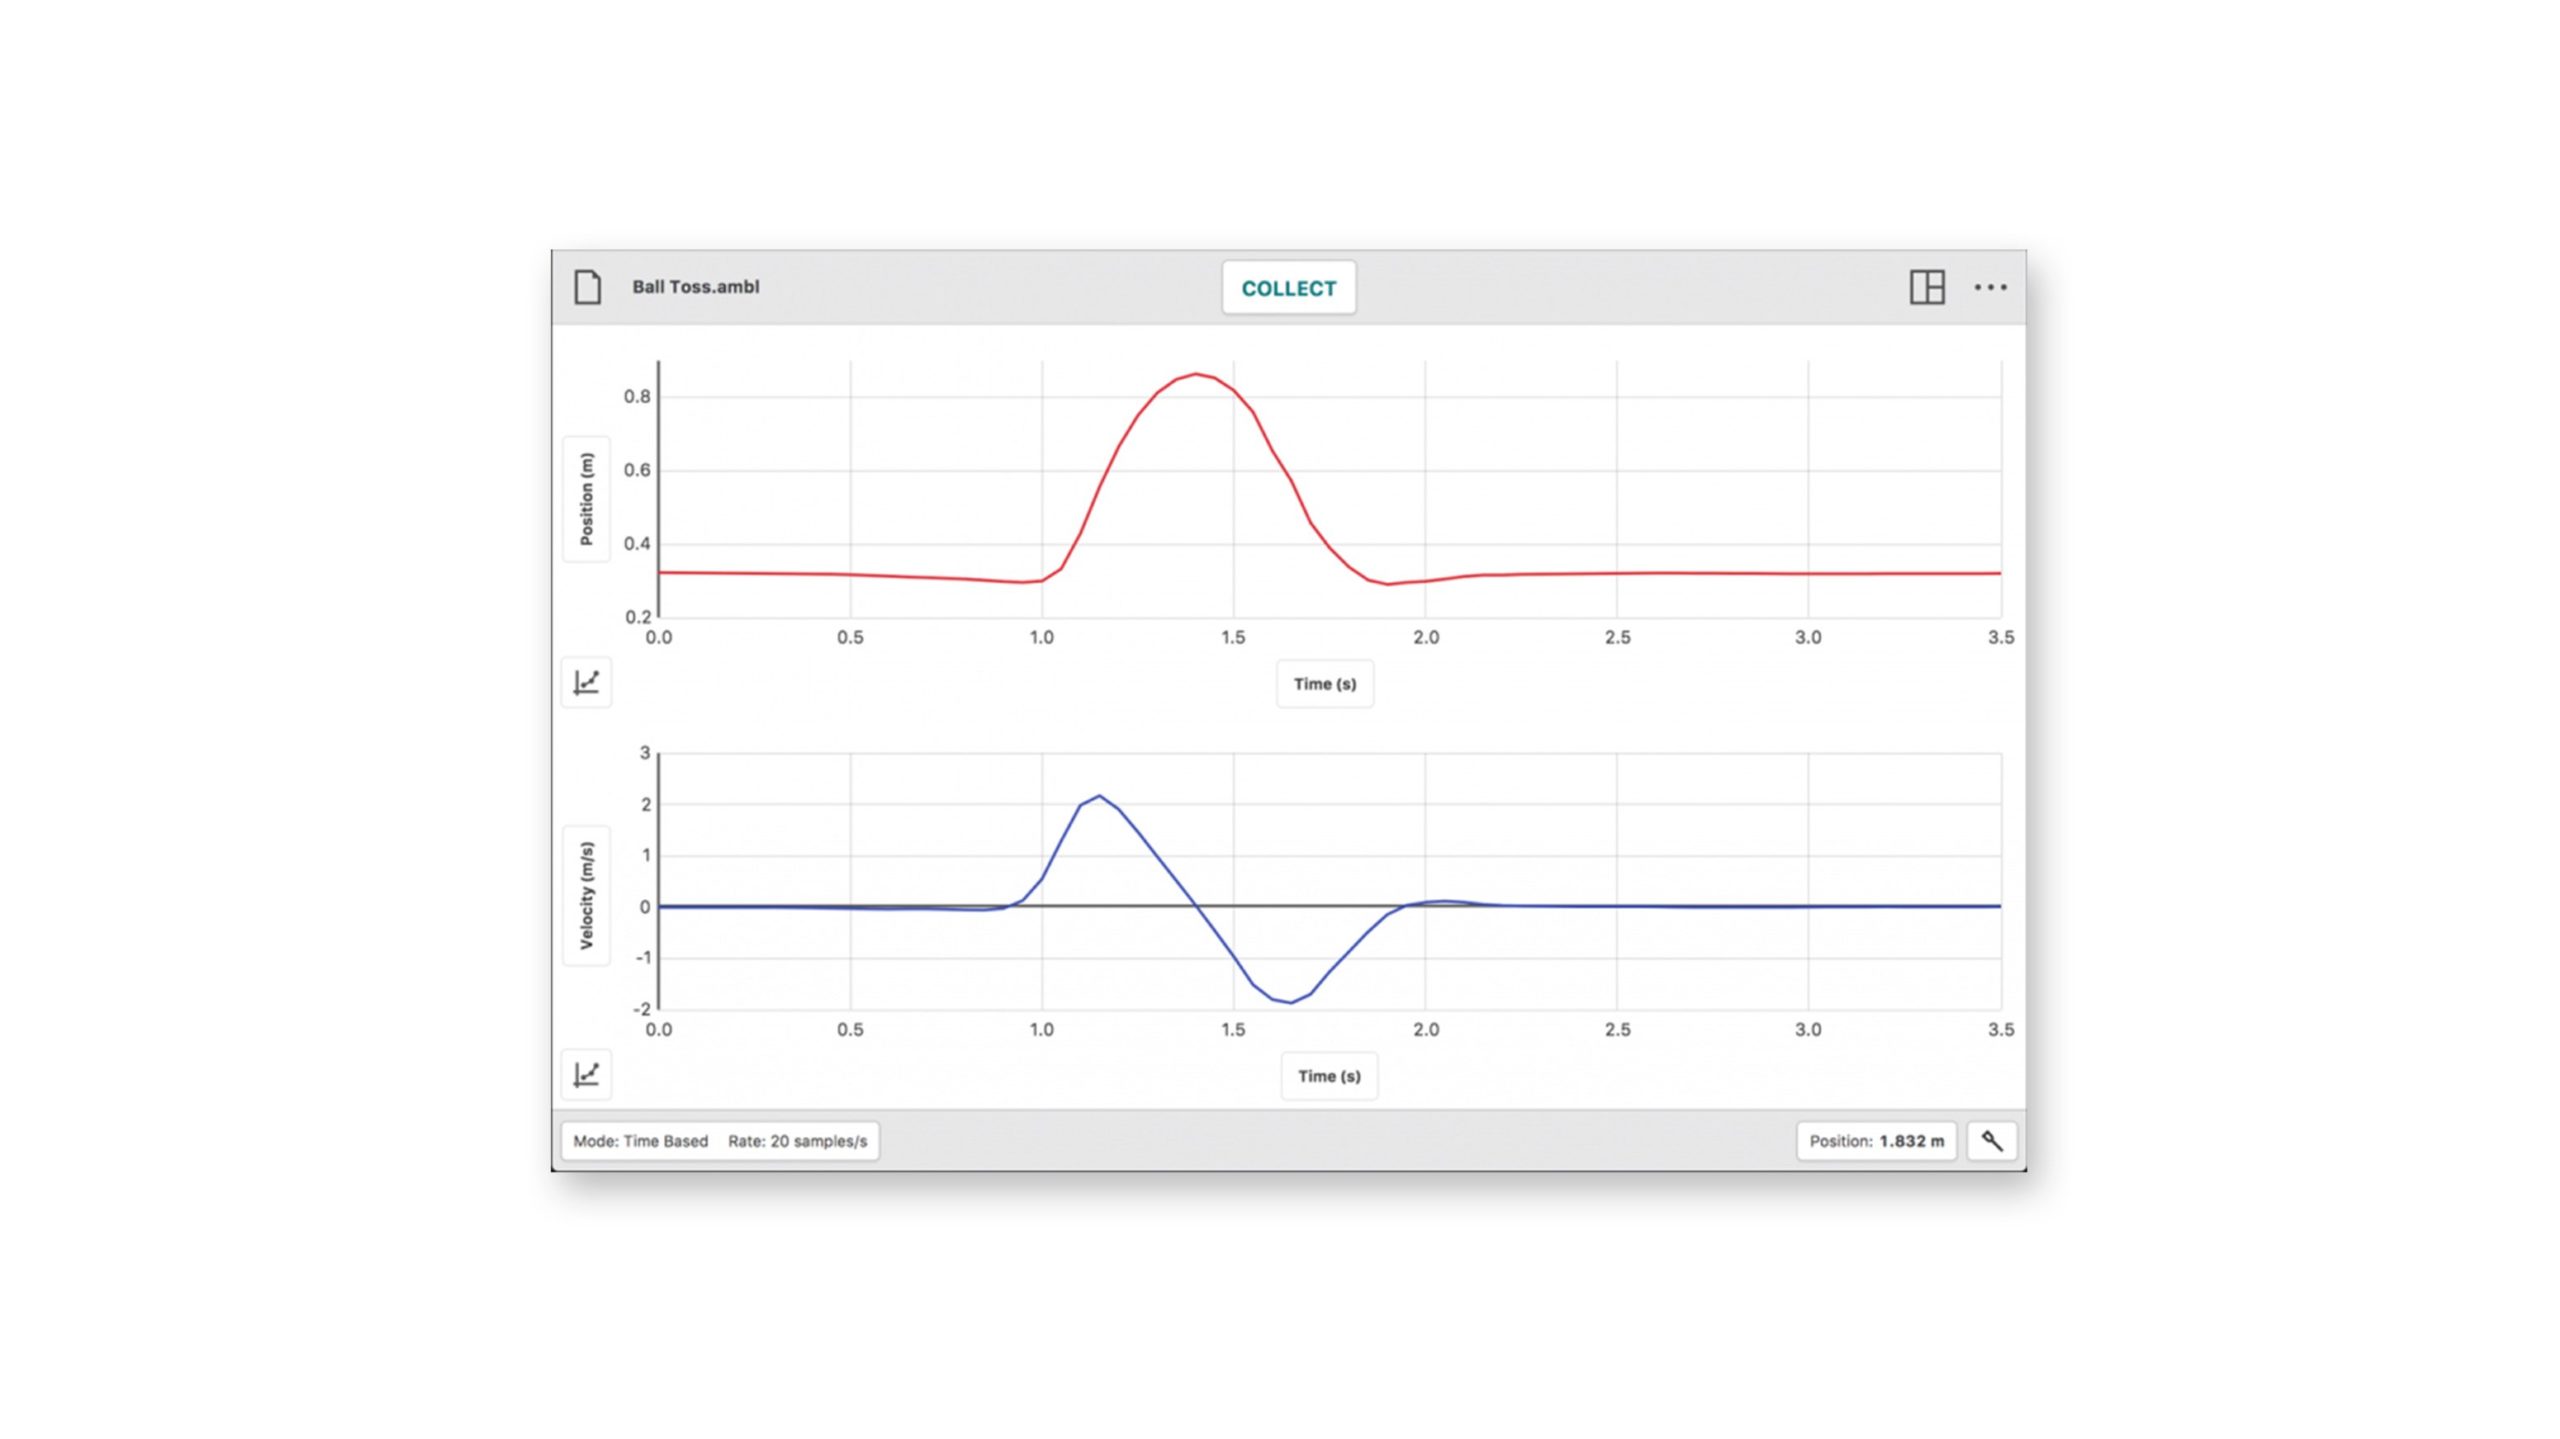
- Display one, two, or three graphs as needed.
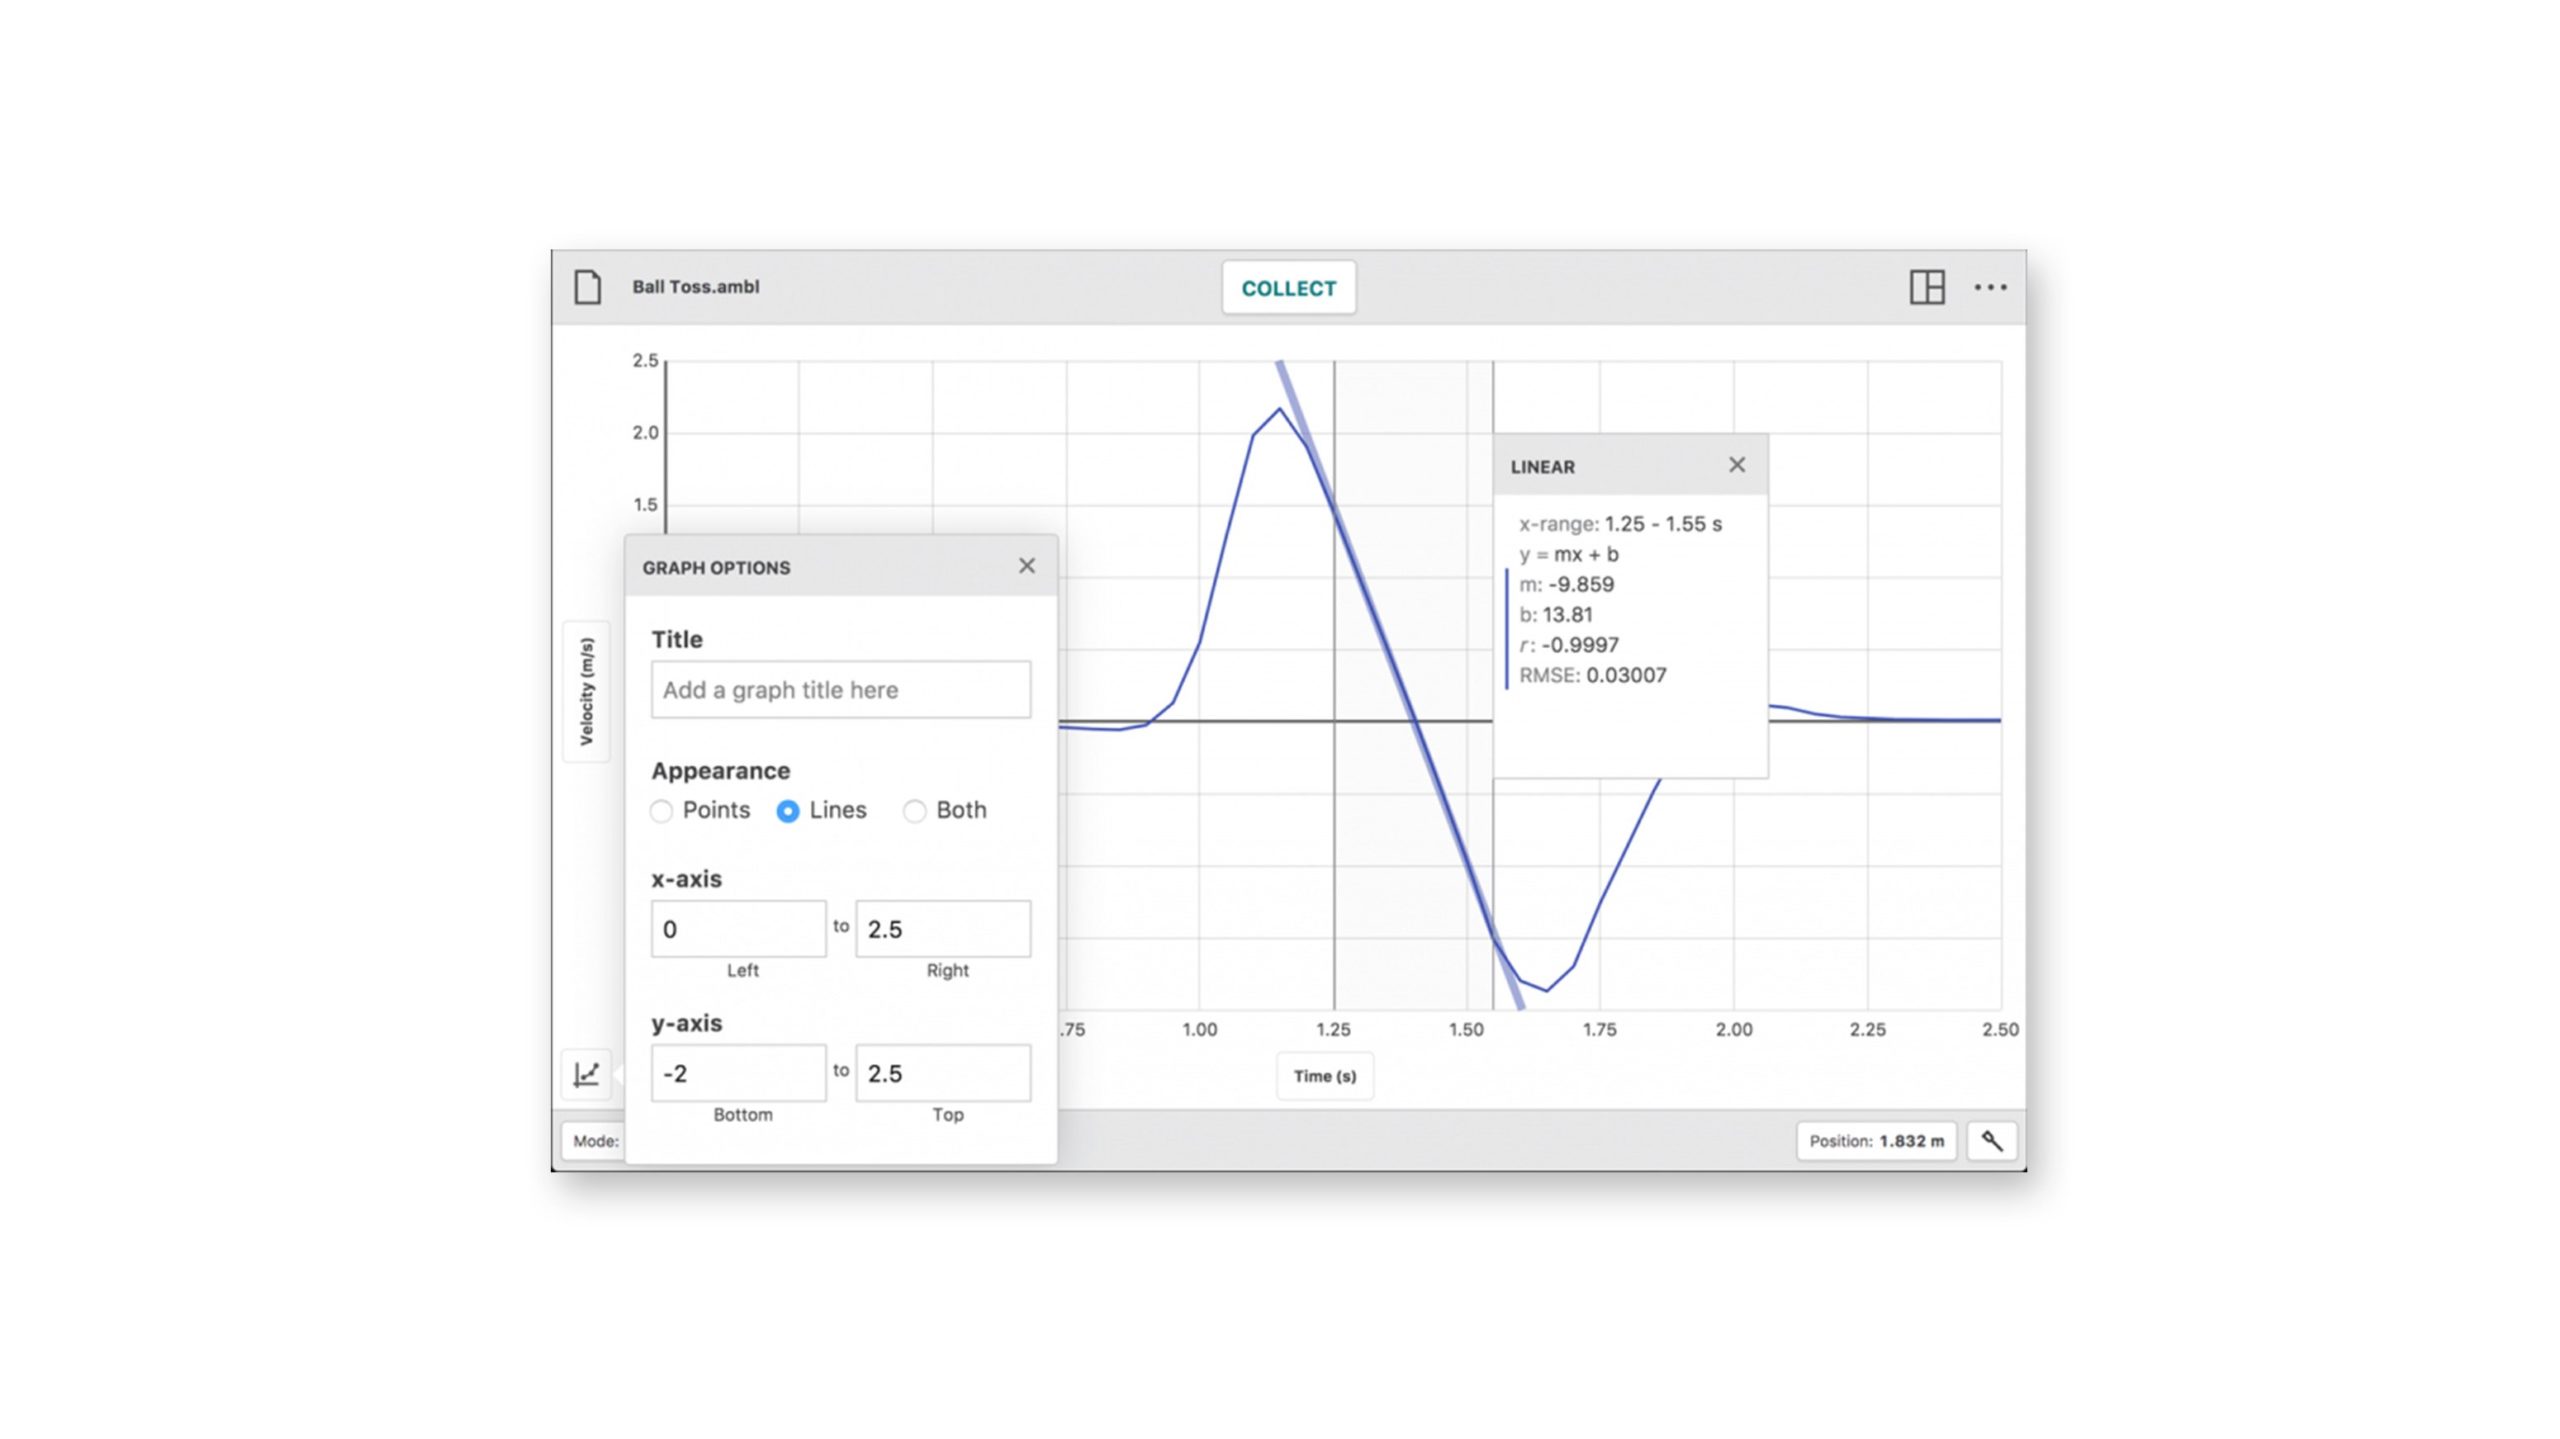
- Set the graph scale.
- Select what is graphed on each axis, and select line- or point-style graphs.
- Calculate descriptive statistics on all or some of your data.
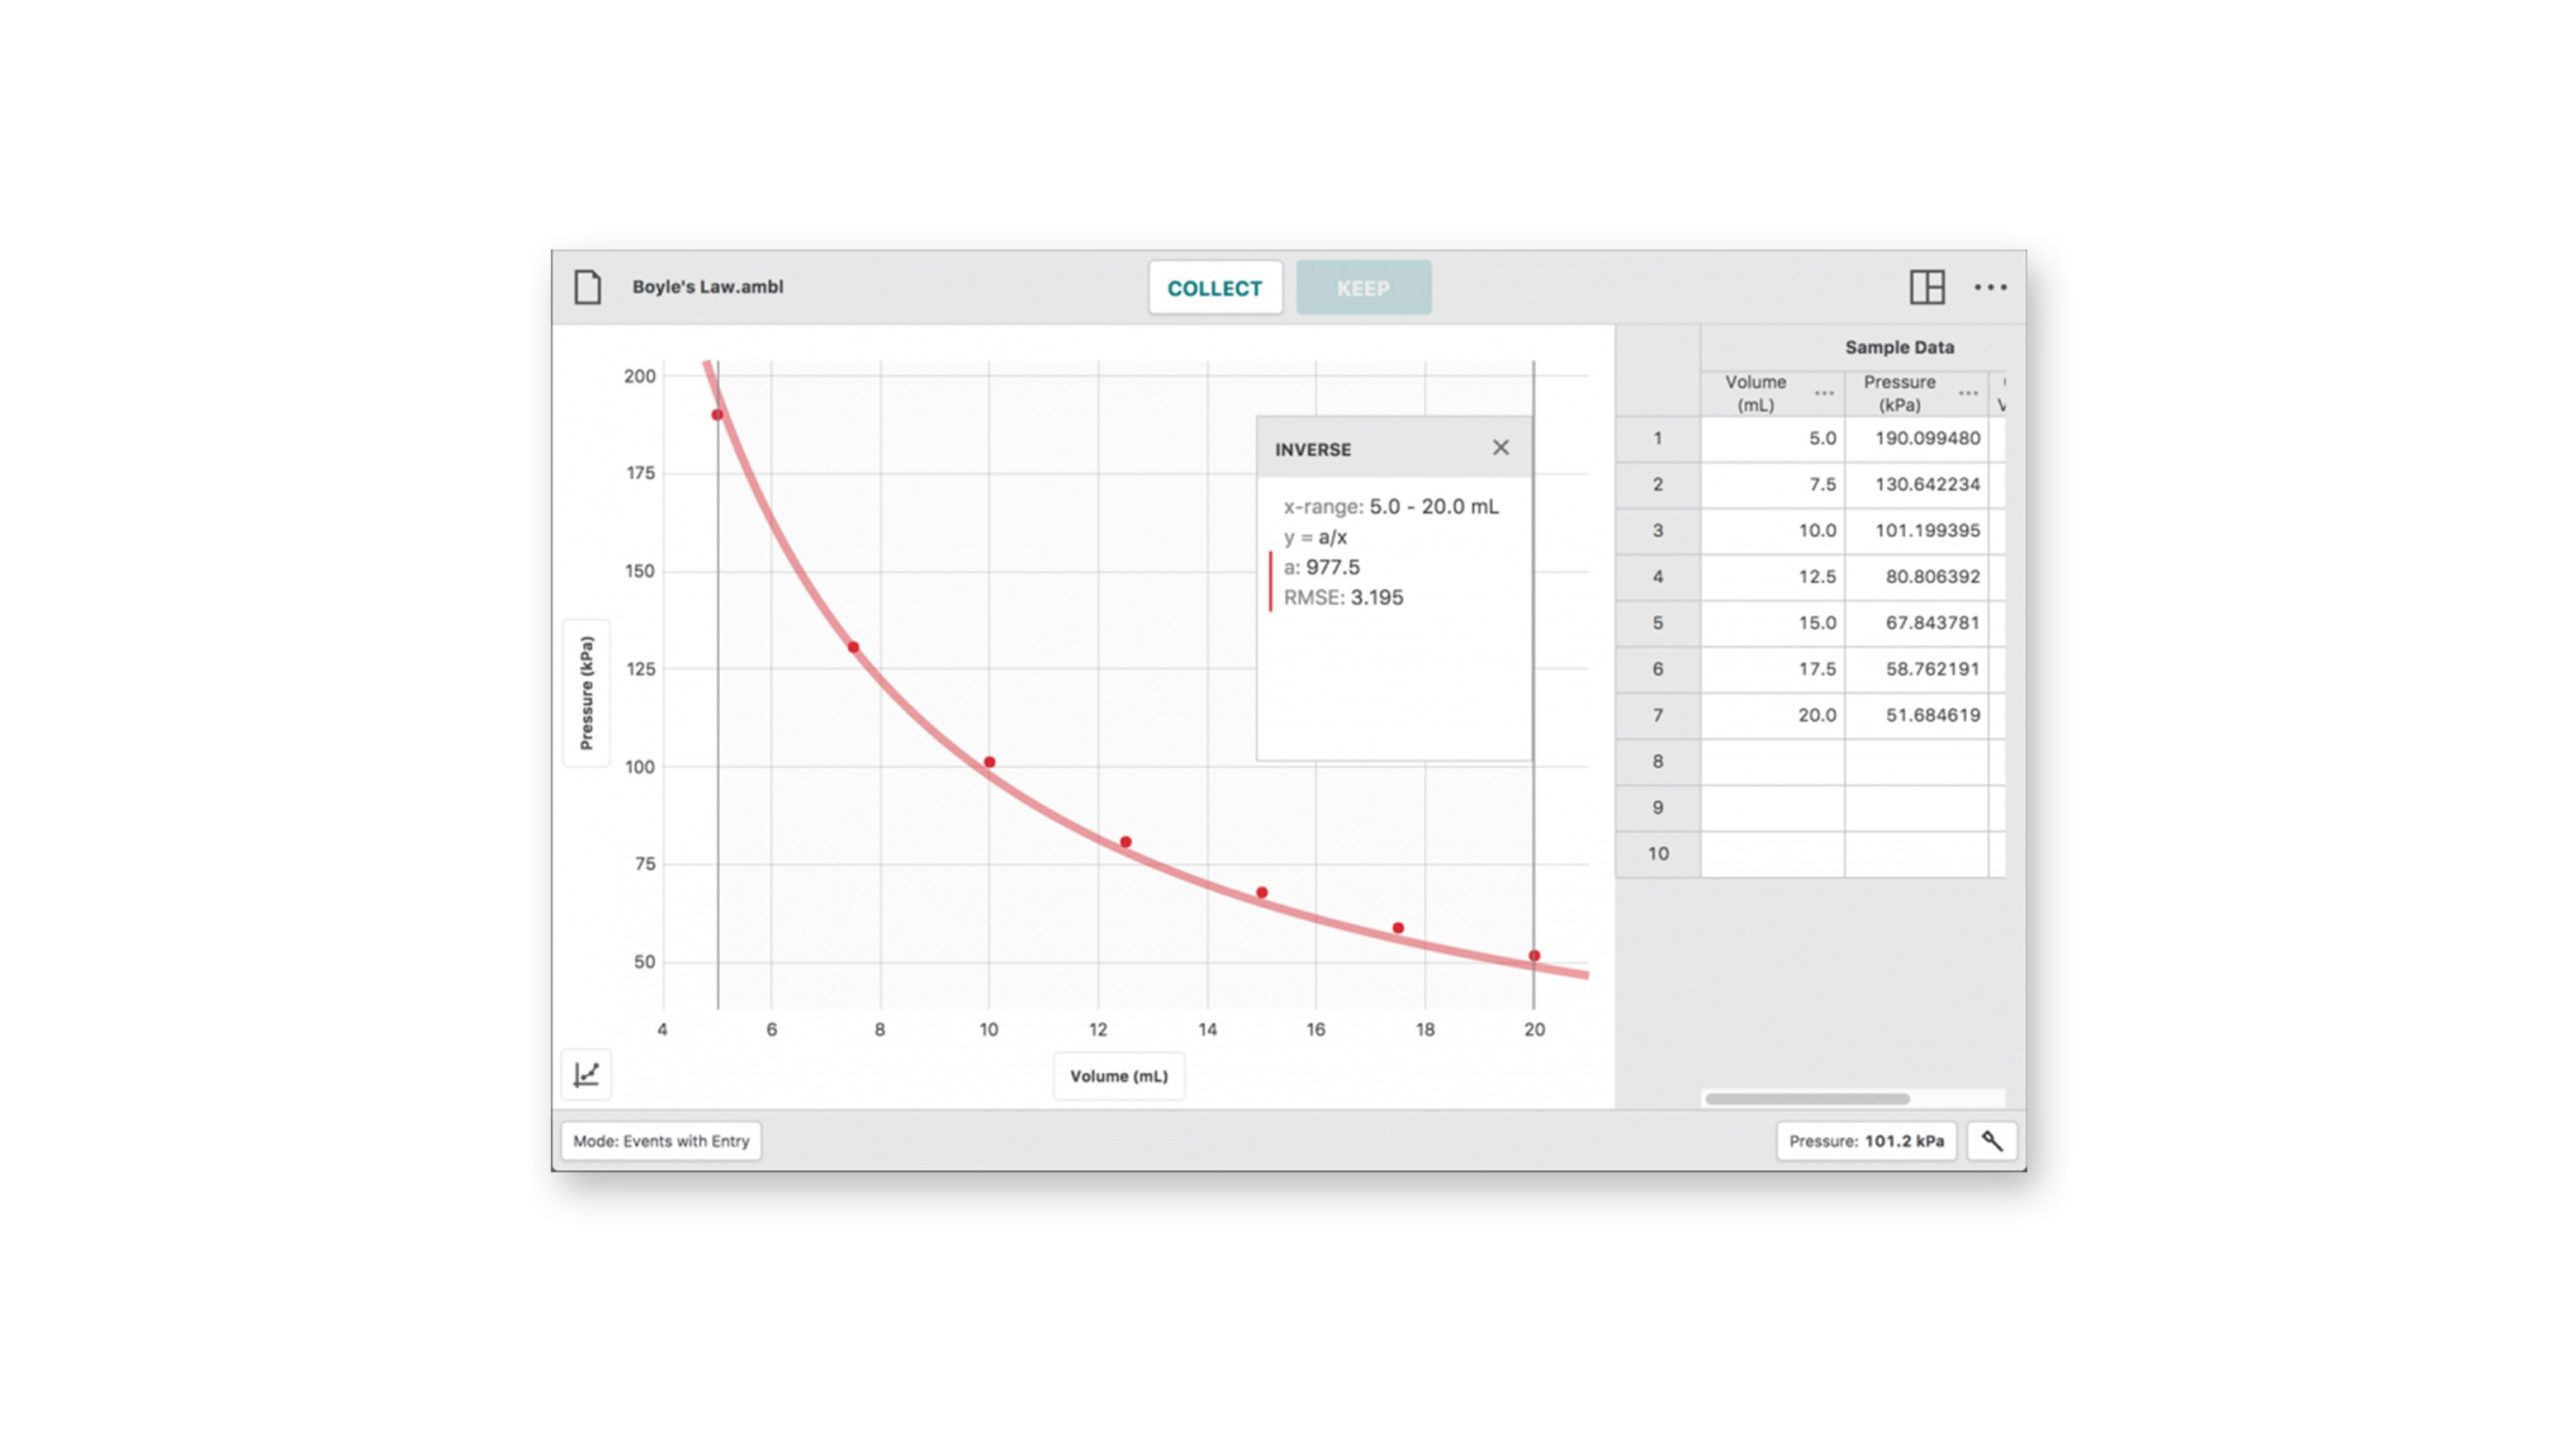
- Fit lines and curves to some or all of your data.
- Define calculated columns based on sensor columns. Use this to linearize a graph, for example.
- View data in a table.
- Highlight and read values from a graph.
- Interpolate and extrapolate using graphed data.
Data Sharing
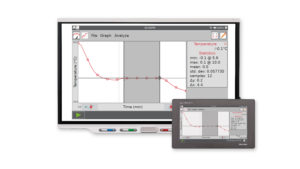
- Receive data shared from LabQuest 3 or a computer running Logger Pro 3 to support 1:1 lab groups.
Data Storage
- Store and retrieve previously shared data collection and analysis sessions.
- Save Graphical Analysis data files with analysis for use in Logger Pro 3.
System Requirements
Windows
Computers running Windows® 10 version 22H2 or newer, or Windows 11 version 21H1 or newer. USB and Bluetooth. Only Windows 10 and Windows 11 computers with compatible Bluetooth radios will support Bluetooth connections. See information about apps for older Windows operating systems.
macOS
Computers running macOS® 12.7.5 or newer. USB and Bluetooth.
Chromebook
Chromebook running ChromeOS™ 132 or newer. USB and Bluetooth®; available exclusively in the browser-based version of the app: graphicalanalysis.app. Going forward this will be the only way to access Vernier Graphical Analysis® on a Chromebook™.
iOS Devices
Devices running iOS or iPadOS® 16.7.8 or newer. See information about apps for older iOS operating systems.
Android Devices
Devices running Android™ 12 or newer.
Progressive Web App
Runs in Chrome™ browser. https://graphicalanalysis.app
See information about our progressive web applications.
Unlock key features with Graphical Analysis Pro and do more with your Vernier sensors to deepen and extend learning. With access to Pro, you can enrich live instruction while providing more opportunities for students to interact with and analyze data outside of class time.
What features are available in Graphical Analysis Pro that are not available in the free version?
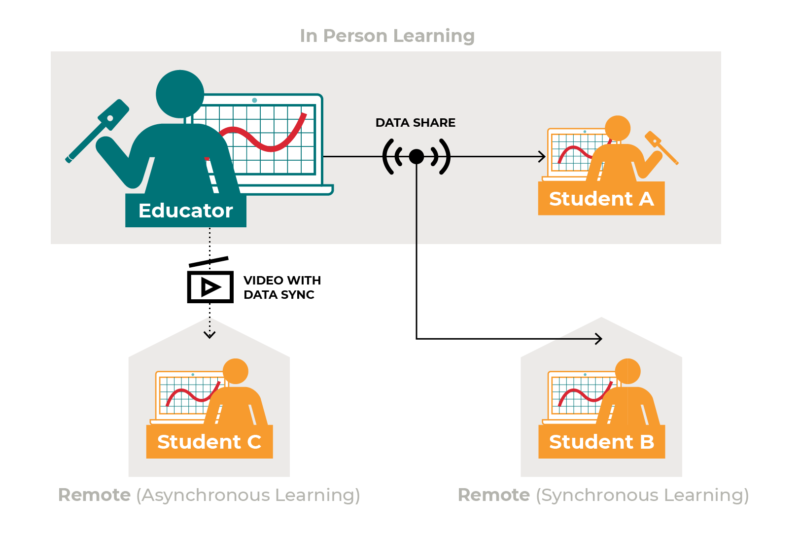 |
Data SharingBoost your students’ understanding of complex science concepts with real-time data sharing. Seeing experiment data collected right before their eyes helps students connect abstract ideas to the real world. |
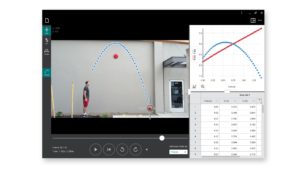
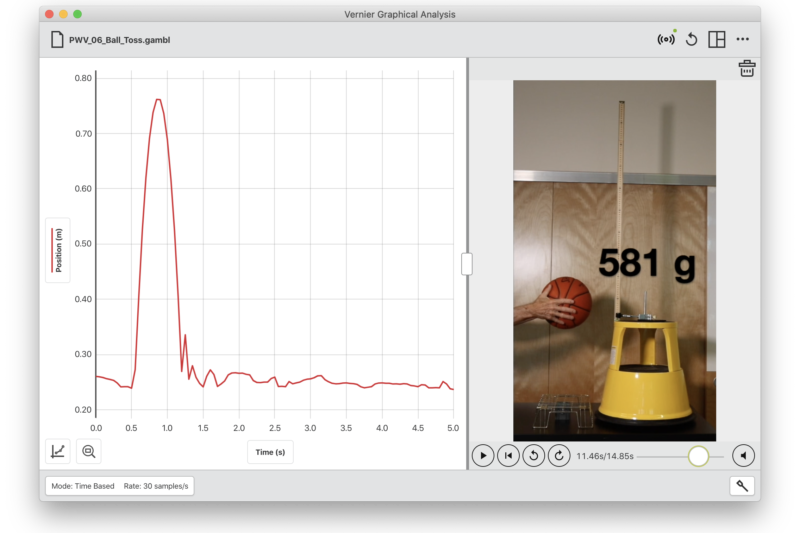
Videos Synced with DataCustomize instruction and learning using your experiment videos synced with data. Your students can even upload and share their own videos. |
 |
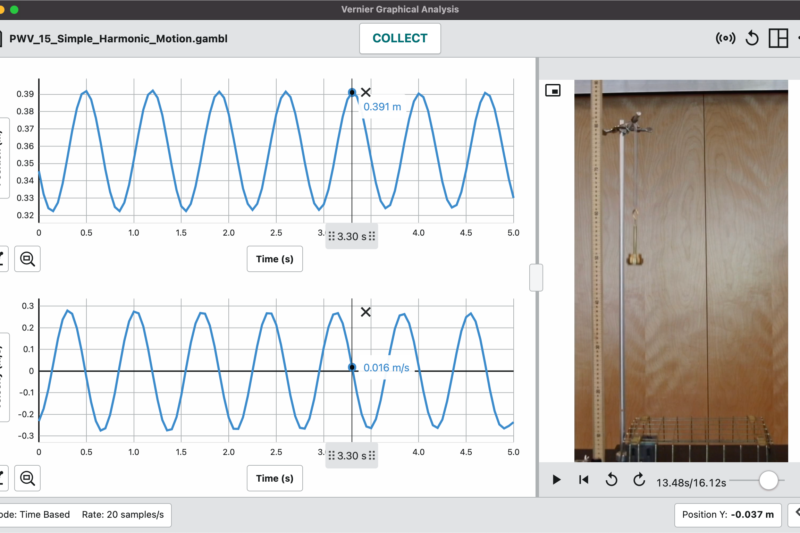 |
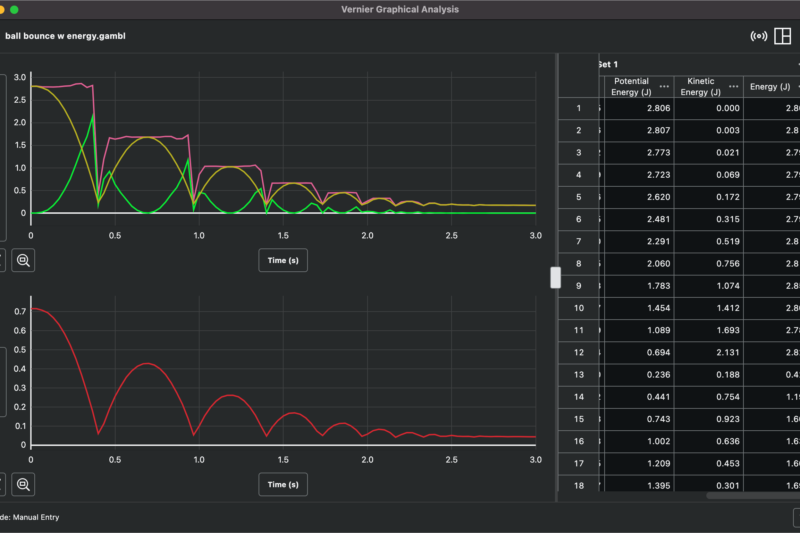
Sample ExperimentsAccess dozens of experiment videos synced with real data to support both remote and in-person learning. These sample experiments help your students experience an experiment, even when lab equipment is unavailable. You can also use sample experiments for pre-labs and differentiation of instruction.
|
Advanced Data AnalysisGive your students more options for deeper analysis with user-defined curve fits and calculated columns. These features provide equation and expression customizations directly in the app for immediate analysis. |
 |