Vernier Graphical Analysis™ Pro
Unlock key features with Graphical Analysis Pro and do more with your Vernier sensors to deepen and extend learning. With access to Pro, you can enrich live instruction while providing more opportunities for students to interact with and analyze data outside of class time.
A subscription site license to Graphical Analysis Pro provides all students and educators at your school with unlimited access to our award-winning app. Have a small class? Purchase the exact number of licenses you need with our per-seat subscription option.
The 1-year site license expires one year from date of activation.
The 3-year site license expires three years from date of activation.
The 1-year individual user license expires one year from date of activation.
Price range: $15.00 through $779.00
Education Levels
- Description
- System Requirements
- Features
- Annual Site License Pricing
- Get Support
- Free Trial
- Additional information
With Graphical Analysis Pro, educators can create experiments and share the data with students in real time. Seeing data collected right before their eyes gives students the ability to connect abstract concepts to real-world applications. Watch our overview video to see data sharing in action.
The enhanced features of Graphical Analysis Pro help students experience three-dimensional learning. As always, we strive to make your job as an educator easier. This is why we created a wide variety of videos with sample experiments synced with data and complete instructions that cover common topics in biology, chemistry, and physics.
Key Features
- Graphical Analysis Pro includes all the features of the Graphical Analysis app plus enhanced features for more advanced analysis.
- The included sample experiments with synced data covers common topics from biology, chemistry, and physics. This provides educators with ready-to-use, rich content for their students to explore and analyze.
- Graphical Analysis Pro is compatible with most Vernier sensors, so educators can continue to use them.
- Our app is compatible with multiple computer operating systems and mobile device platforms—including Chromebooks, which provides flexibility and cost savings, as students can use their own device for analysis.
- Graphical Analysis Pro offers an intuitive interface making it easy to use and get started.
- As always, we offer great customer service from the experts on our technical support team.
 |
Data CollectionCollect experiment data from multiple sensors simultaneously using a multiple-channel interface, such as LabQuest Stream® or multiple Go Direct® sensors. |
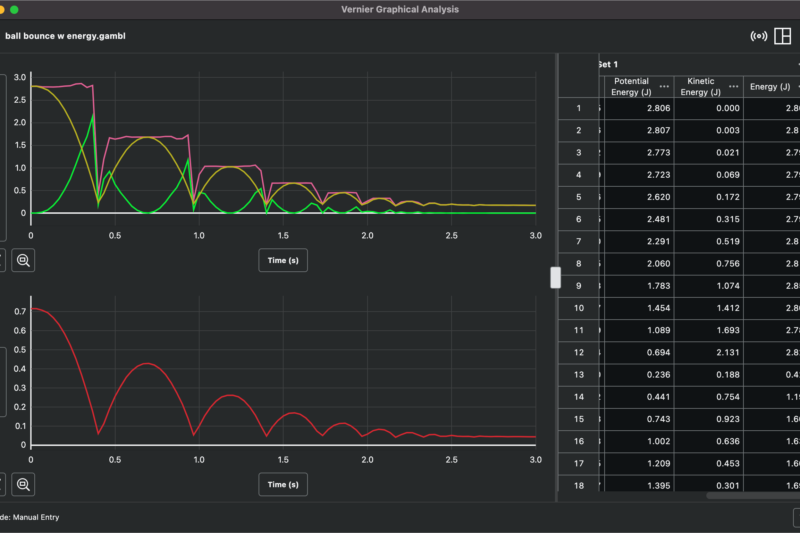
Data VisualizationHelp your students visualize experiment data—and increase comprehension and retention—with richly detailed, customizable graphing. |
 |
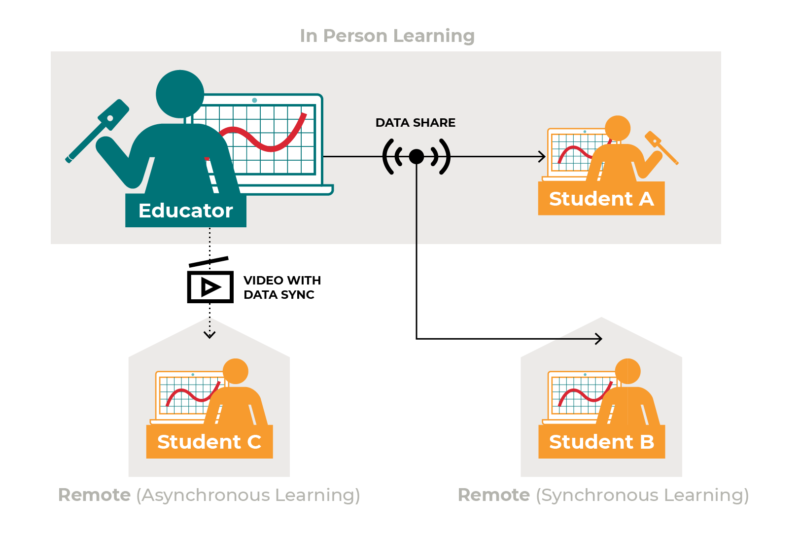 |
Data SharingBoost your students’ understanding of complex science concepts with real-time data sharing. Seeing experiment data collected right before their eyes helps students connect abstract ideas to the real world. |
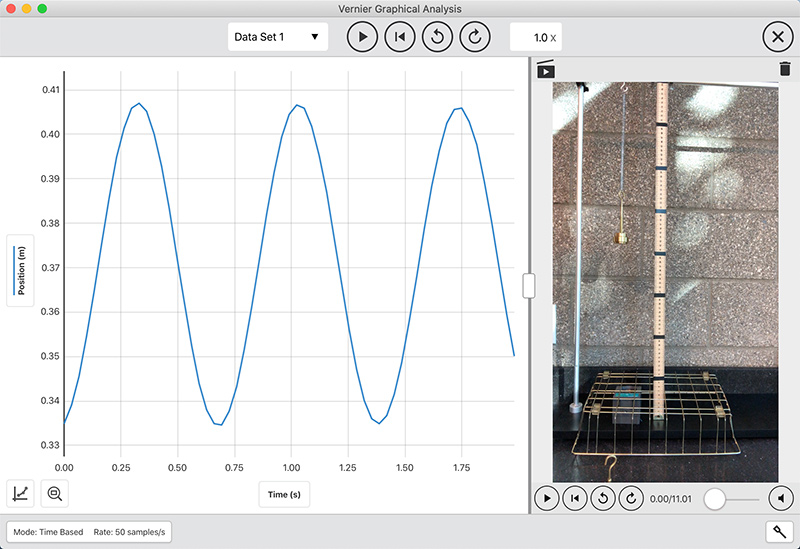
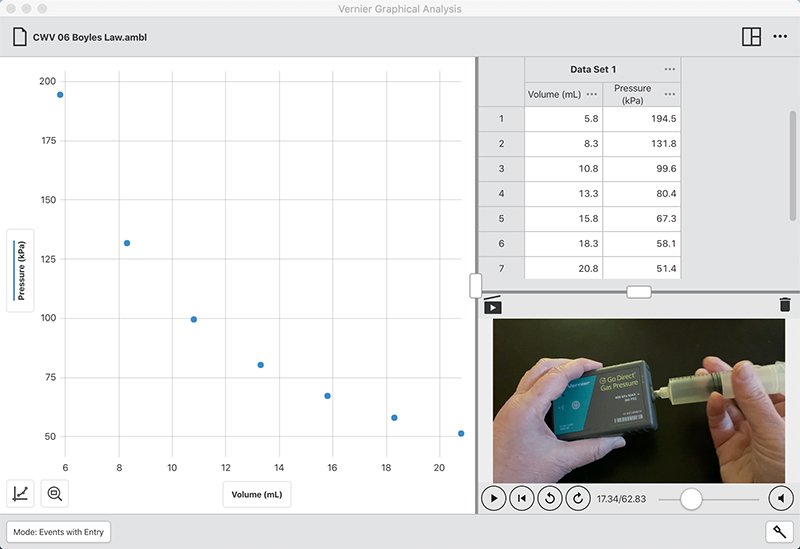
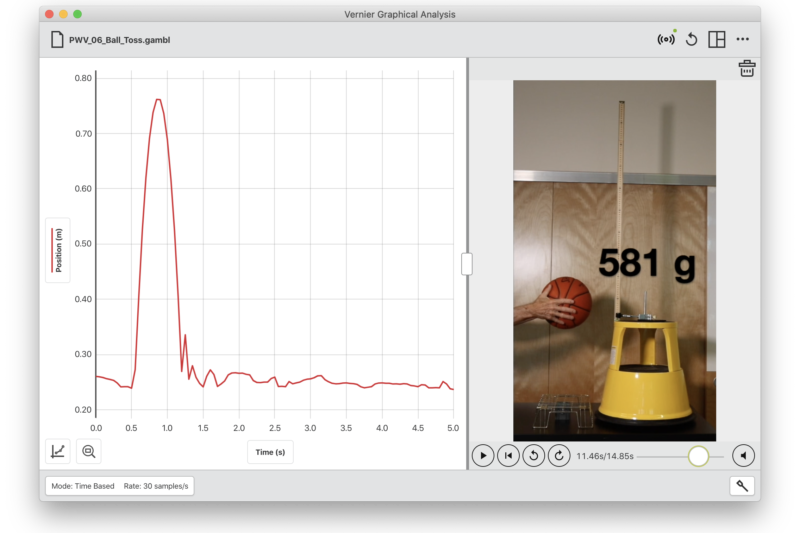
Videos Synced with DataCustomize instruction and learning using your experiment videos synced with data. Your students can even upload and share their own videos. |
 |
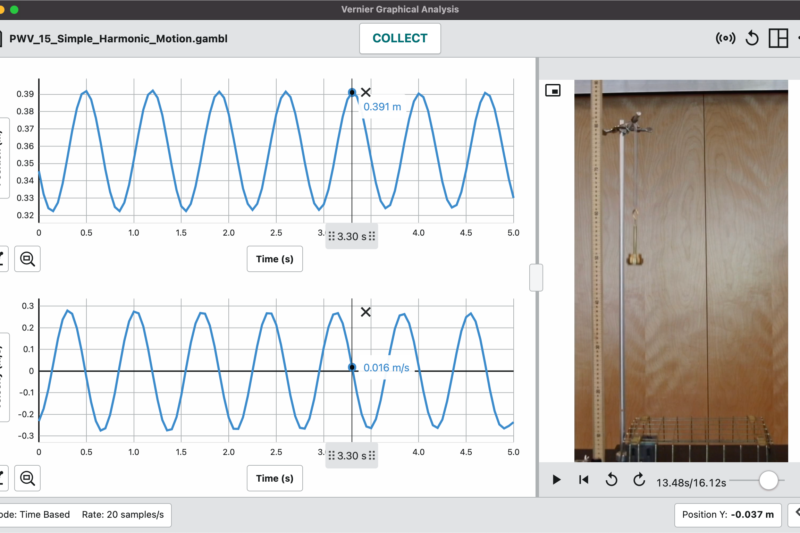 |
Sample ExperimentsAccess dozens of experiment videos synced with real data to support both remote and in-person learning. These sample experiments help your students experience an experiment, even when lab equipment is unavailable. You can also use sample experiments for pre-labs and differentiation of instruction.
|
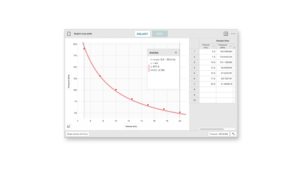
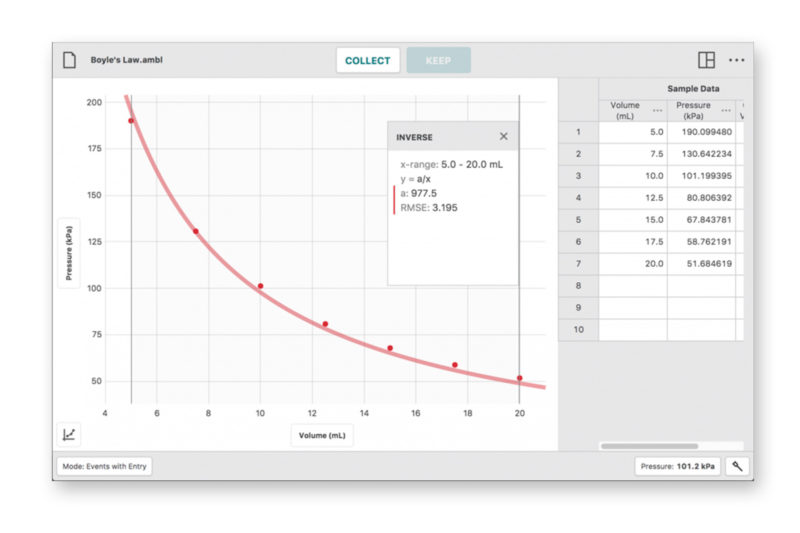
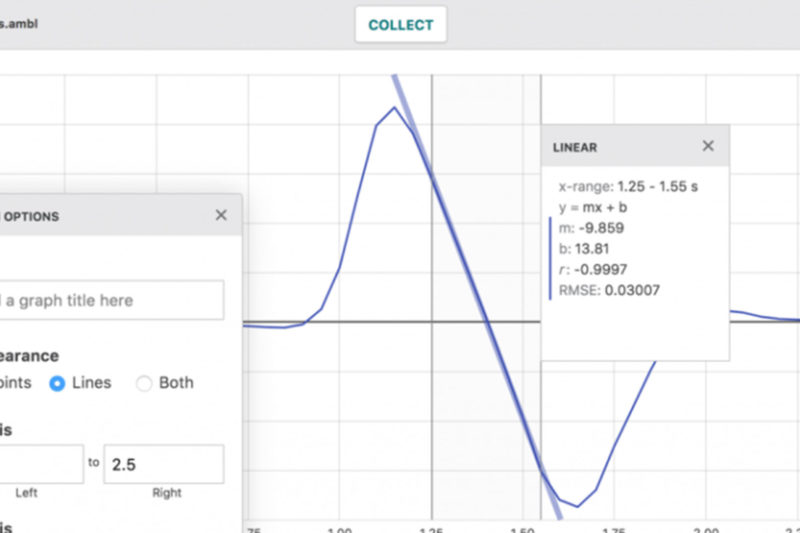
Advanced Data AnalysisGive your students more options for deeper analysis with user-defined curve fits and calculated columns. These features provide equation and expression customizations directly in the app for immediate analysis. |
 |
![]()

![]()


Windows
Computers running Windows® 10 version 2043 or newer, or Windows 11 version 21H1 or newer. USB and Bluetooth®.
macOS
Computers running macOS® 10.15.6 or newer. USB and Bluetooth.
Chromebook
Chromebooks running ChromeOS™ 102 or newer. USB and Bluetooth.
iOS Devices
Devices running iOS or iPadOS® 14.8.1 or newer. See information about apps for older iOS operating systems.
Android Devices
Devices running Android™ 9 or newer.
| Feature | GA BASIC | GA PRO |
|---|---|---|
| Features accessible from the Welcome Screen/File Menu | ||
| Data collection with Go Direct and/or LabQuest (wired) sensors | ☑ | ☑ |
| Manual Data Entry | ☑ | ☑ |
| Data Sharing from LabQuest 2, LabQuest 3, or Logger Pro | ☑ | ☑ |
| Online Data Sharing | ☑ | |
| Open .ambl and .gambl (Graphical Analysis), .qmbl (LabQuest), .imbl (Instrumental Analysis), and .smbl (Spectral Analysis) files |
☑ | ☑ |
| Open .csv files | ☑ | ☑ |
| Sample Experiments & Videos library within the app | ☑ | |
| Export graph as png | ☑ | ☑ |
| Export data as csv or ambl | ☑ | ☑ |
| Export graph as pdf | ☑ | |
| Features accessible from Graph Tools menu | ||
| Add Graph Legend or Graph Predictions | ☑ | ☑ |
| Use Interpolate, Tangent, Statistics, Integral | ☑ | ☑ |
| Add a right Y axis to graphs | ☑ | |
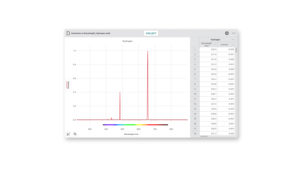
| Apply a Fast Fourier Transform (FFT) | ☑ | |
| Apply Strikethrough to ignore unwanted data | ☑ | |
| Linked X axes for multiple graphs | ☑ | ☑ |
| Apply basic (Vernier-defined) Curve Fits | ☑ | ☑ |
| Apply custom (user-defined) Curve Fits | ☑ | |
| Show uncertainty of curve fit parameters | ☑ | |
| Show units in linear fit parameters | ☑ | |
| Manual linear fit with draggable line | ☑ | |
| Add Graph Match (Position and Velocity) – Vernier-defined matches | ☑ | ☑ |
| Use-defined/user-modified Graph Matches (Position and Velocity) | ☑ | |
| Add Annotations | ☑ | ☑ |
| Add Annotations on a point or region | ☑ | |
| Bar Graphs | ☑ | |
| Histograms | ☑ | |
| Features accessible from Data Collection Settings (mode button) | ||
| Time-Based Data Collection | ☑ | ☑ |
| Event-Based Data Collection | ☑ | ☑ |
| Data Marking | ☑ | |
| Features accessible from Table menus | ||
| Rename Data Set | ☑ | ☑ |
| Delete Data Set | ☑ | ☑ |
| Add Manual Columns | ☑ | ☑ |
| Add basic (Vernier-defined) Calculated Columns | ☑ | ☑ |
| Add custom (user-defined) Calculated Columns | ☑ | |
| Add Error Bars | ☑ | |
| Use categorical data | ☑ | |
| Views accessible from View Options menu | ||
| Access a Graph, Table, and/or Meter view | ☑ | ☑ |
| Access a Notes field view | ☑ | |
| Access a Video view | ☑ | |
| Sync collected data to a video | ☑ | |
| Replay data collection (with or without a video) | ☑ | |
| Display meters from all columns, including calculated columns | ☑ | |
| Features accessible from Other Options menu | ||
| About menu: access version number and applicable license information | ☑ | ☑ |
| App Preferences: Toggle Dark Mode and Scale Factor features | ☑ | ☑ |
| Set Language that is different then the language of the operating system | ☑ | |
| Display Zero Sensor [∅] button on large meters | ☑ | |
| Session Preferences: Set number of points for derivative and smoothing calculations |
☑ | |
| User Manual | ☑ | ☑ |
| Distribute App: Easily share Graphical Analysis Pro with others | ☑ | |
| Check for Updates: Update app to latest version | ☑ | ☑ |
| Support for Apple Silicon Macs | ☑ | ☑ |
| What’s New: List of features added | ☑ | ☑ |
Site Licenses
Graphical Analysis Pro is distributed as a subscription site license, which permits use of the app on any device under the school’s control—as well as access to the app by any of the school’s staff/faculty members and students, who may also use the app on their personal devices.
Site licenses are available for different durations, depending on your purchase. Your subscription starts the day you activate the license. Individual licenses are available only for educators.
Access to Graphical Analysis Pro may not be granted to individuals outside of the school.
School Board Licenses
We offer K–12 school board licenses (minimum 5 schools). Get pricing for your board by contacting us at [email protected].
Free Trial
Try Vernier Video Analysis free for 30 days. Explore the analysis tools in this easy-to-use application with your students.
Request Free Trial
Students, get access through your instructor.
| License | 1-Year Individual License (per seat), 1-Year Site License (unlimited seats), 3-Year Site License (unlimited seats), 5-Year Site License (unlimited seats) |
|---|